This Fragment-centric Topographical Mapping (FCTM) tutorial will demonstrate the use of AlphaSpace to map the Mdm2 surface at the Mdm2/p53 interface. All the files used in this example can be found in the "Example_FCTM" directory within the main "AlphaSpace_v1.0" directory.
AlphaSpace is written in Python and utilizes several NumPy functions and the SciPy packages: scipy.cluster, scipy.spatial, and scipy.sparse.
If you do not have these installed, Enthought Canopy is a good option to utilize as a freely available scientific Python package manager.
The visualization software Chimera (freely available for academic use) will be used to visualize the AlphaSpace mapping.
Naccess is used to calculate accessible-surface area (ASA) of proteins at the atomistic level. To use AlphaSpace to its full extent, the atomistic ASAs of pocket atoms will be used in the non-polar weighting of individual alpha-spaces, which contribute to the total pocket score. However, it is possible to run AlphaSpace without installing Naccess (see the parameters page: use_naccess = False). In this case, pocket scores will still have non-polar weighting, but the atomistic ASA of each pocket atom is considered to be equal, so the overall pocket score will be less precise.
Naccess is freely available for academic use. To use Naccess, you must download the program and send an email to the developer to obtain the encryption key (see this page). Once you have decrypted and unpackaged the download, Naccess can be compiled for usage by running the installation script:
csh install.scr
Note 1: Naccess is written in Fortran, so compilation requires the use of a Fortran compiler (such as: gfortran or f77). You may need to modify the "compile program" section of the Naccess installation script to call your particular Fortran compiler, for example:
gfortran accall.f -o accall -O
Note 2 (bug fix): You may have to change line 255 of "accall.f" from: write(4,'(a,i)') to: write(4,'(a,i8)')
Note 3: To use with AlphaSpace, Naccess must be executable by typing "naccess" at the command line. This can be set up, following Naccess installation, by adding the Naccess program directory to your PATH variable. For example, if using bash, add the following lines to your .bashrc (Linux) or .bash_profile (Mac) file in your home directory:
export NACCESS_DIR='path to your Naccess directory'
export PATH=$PATH:$NACCESS_DIR
In addition, make sure that the "naccess" script within your Naccess directory points to the right directory. At the top of this "naccess" script should be:
export EXE_PATH='path to your Naccess directory'
AlphaSpace can map a complete protein surface or can be restricted to map just the interface between a protein and a binding partner. The "protein" part and the "binder" part are identified from a single PDB file as follows...
AlphaSpace will automatically strip all non-ATOM/HETATM lines from the input PDB file, and additionally will strip all protons, water molecules, and Na+/Cl- ions. There are two options for specifying which atoms to treat as the "protein" (the target surface to be mapped) and which atoms to treat as the "ligand" (the protein binder). The first (parameter: use_TER = True) will read any ATOM or HETATM up to the first "TER" card as "protein", and any ATOM or HETATM to follow as "ligand". The second (parameter: use_TER = False) will instead identify as "ligand" all HETATM lines and all ATOM lines with new Chain IDs (compared to the initial Chain ID encountered in the PDB file).
All variable AlphaSpace parameters and options are listed in (and read from) the "AS_param.txt" and "AS_option.txt" files. These parameters and options control various elements of pocket identification, selection, and evaluation. See the parameters page and the options page for a detailed description of each parameter and option. These files will be read, primarily, from the current working directory, and, secondarily, from the "AlphaSpace.py" program directory. Here are the parameter settings used for this example:
min_r = 3.2
max_r = 5.4
clust_dist = 4.7
min_num_alph = 1
hit_dist = 1.6
core_cutoff = 100
aux_cutoff = 30
And here are the option settings for this example:
output_dir = .
output_to_screen = False
use_TER = True
do_reverse = False
use_naccess = True
use_NP_wt = True
use_exact_ACSA = True
get_face = True
screen_by_face = True
screen_face_perc = 0.5
screen_by_lig_cntct = False
expand_around_cntct = False
screen_by_score = False
min_score=100
screen_by_perc_rank = False
min_perc_rank = 0.9
screen_out_subsurf = False
max_desolv_perc = 0.95
screen_by_res = False
res_file = screen_resID.pdb
pocket_communities = True
Of particular interest are the options: "screen_by_face" and "screen_by_lig_cntct". If only pockets in direct contact with the ligand are desired, set screen_by_lig_cntct = True. In order to expand the pocket selection to also include unoccupied pockets in the vicinity of the ligand, set screen_by_lig_cntct = False and set screen_by_face = True. This setting will select pockets, not by ligand contact, but if a percentage of atoms from the pocket atom list are within the "interface" atom list. This option requires Naccess to be activated in order to calculate the interface atom list.
Alternatively, if you are interested in a specific region of the surface but cannot use a ligand contact or interface to screen pockets, you can provide a list of residues in PDB format and only pockets containing at least one atom from at least one residue within this PDB file will be selected, screen_by_res = True.
Your current working directory can be different from the AlphaSpace.py program directory, but the following files should exist in the program directory:
AlphaSpace.py
AS_class.py
AS_fcn.py
AS_param.py
AS_option.py
pdbinfo.py
vdw.radii
AS_chimera.py
colors_chimera.txt
colors_table.txt
The PDB file of your protein complex is passed to AlphaSpace as a command line argument. From your working directory, enter the following:
python "your_program_directory"/AlphaSpace.py "your_protein_complex".pdb
The following output files and directories should be generated:
table_score.dat
table_communities.dat
sub_pockets/
pdb_files/
draw/
AS_chimera.py
colors_chimera.txt
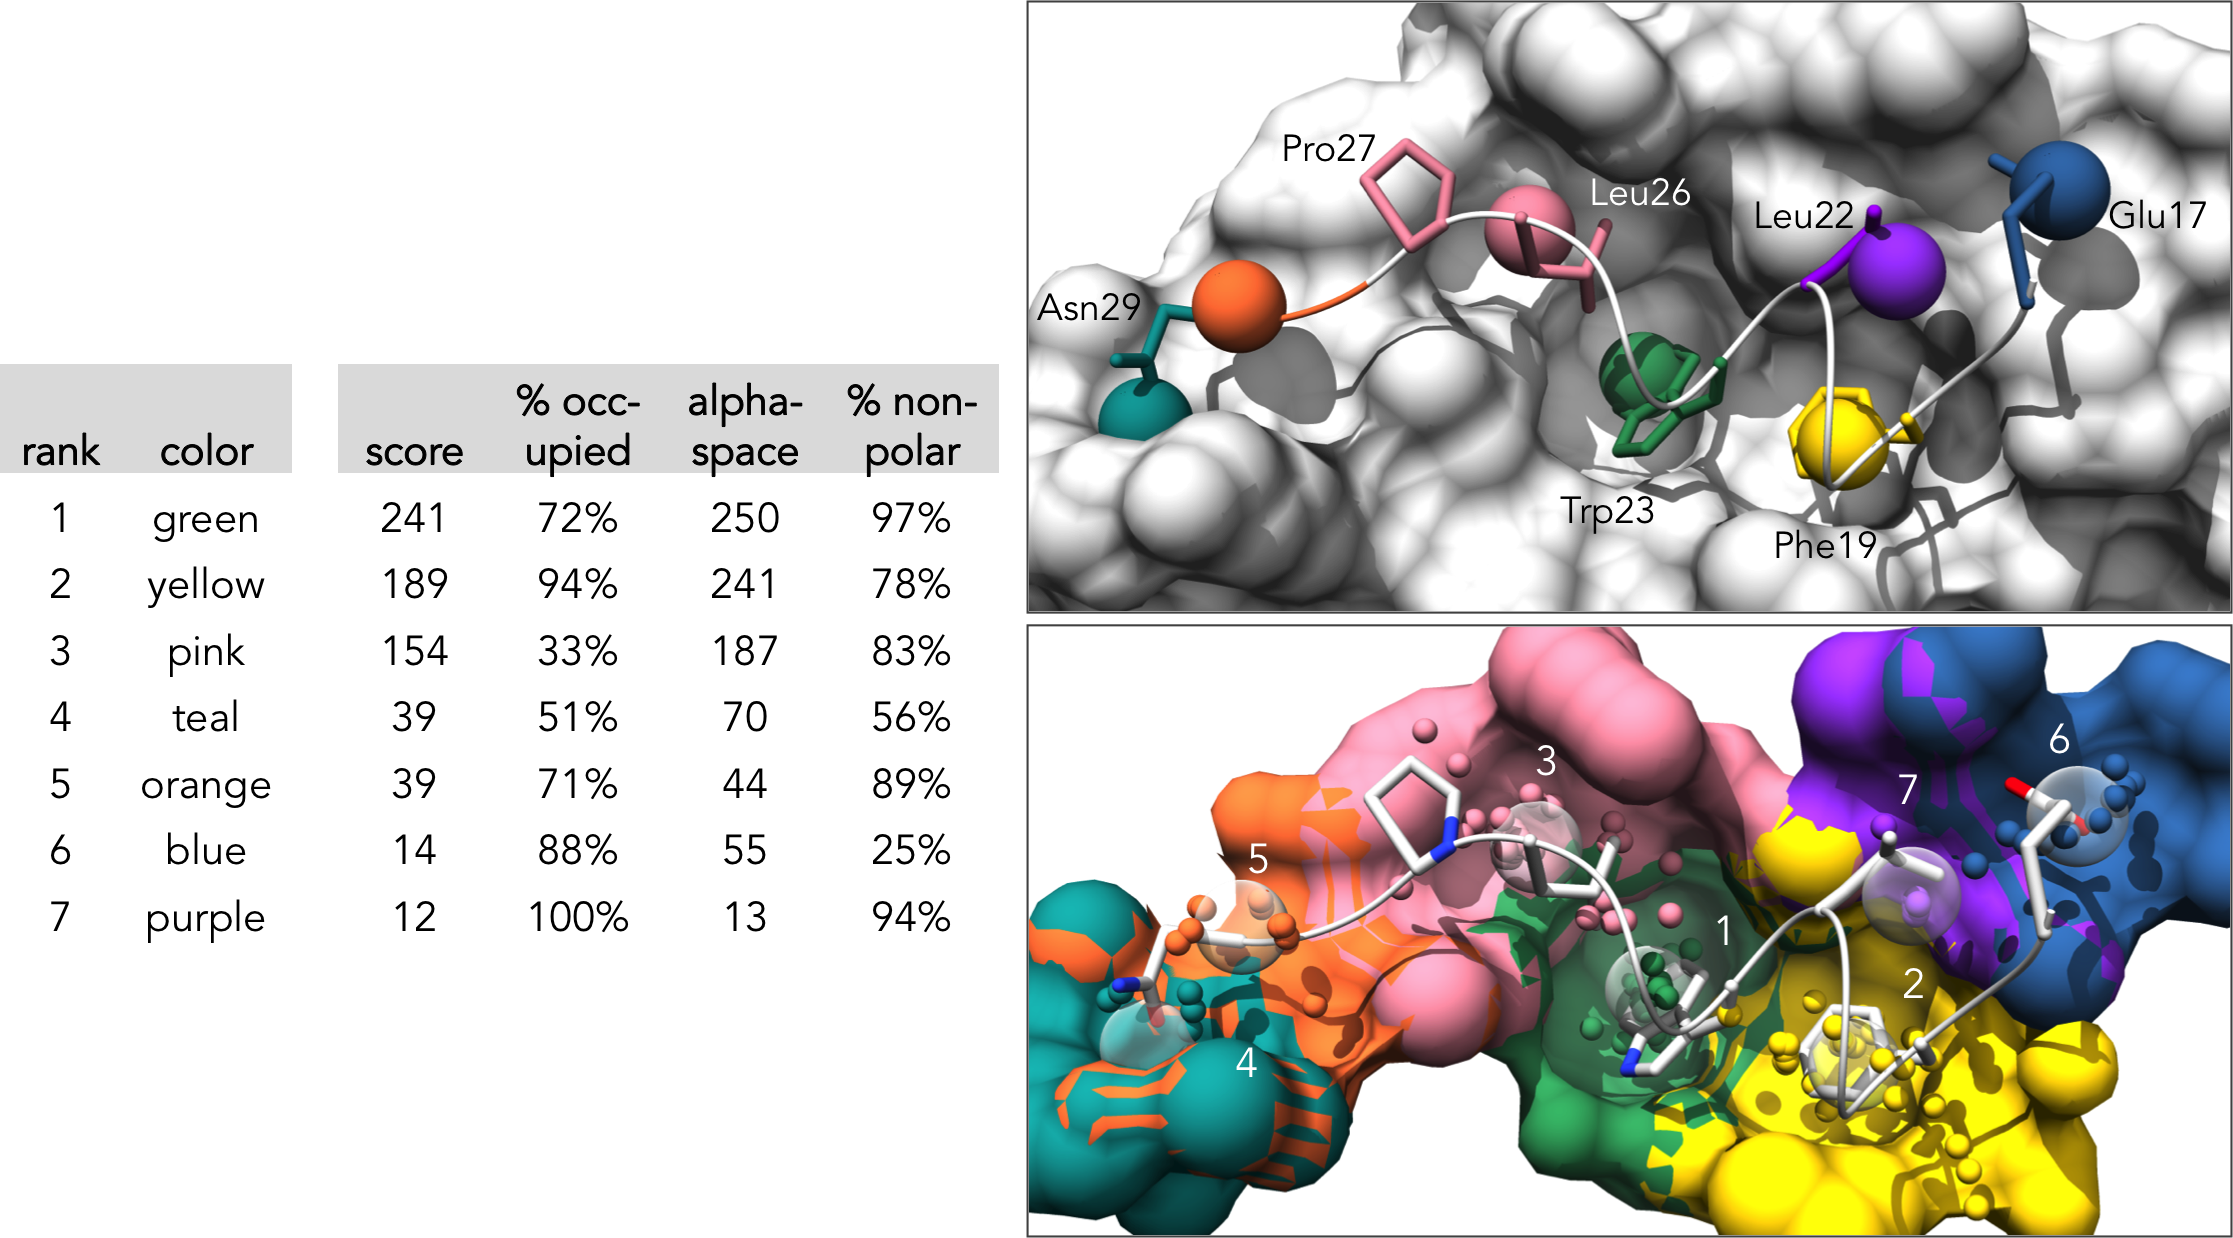
The main pocket features for the selected pockets will be listed in "table_score.dat". The first line lists the features corresponding to each column (separated by ';'). The feature values are "tab" separated. (note: for this section we use screen_by_lig_cntct = True in order to focus the analysis to ligand-occupied pockets only:
rank;color;score;% occupied;space;% non-polar
1 green 243 72% 250 97%
2 yellow 190 94% 241 79%
3 pink 157 33% 187 84%
4 teal 41 51% 70 59%
5 orange 39 71% 44 89%
6 blue 15 88% 55 27%
7 purple 12 100% 13 92%
Here is the formatted pocket data table and the matching pocket visualization:
Results for the Pocket communities analysis will be listed in "table_communities.dat". For each pocket community, the table lists the community rank, the community score (which is the sum pocket score of all core and auxiliary pockets), the core pocket IDs, the auxiliary pocket IDs, and the minor pocket IDs:
#Rank Score CoreID AuxID MinorID
1 628 1,2,3 5 7
The remaining output is used for visualization:
(note: if this is your first time visualizing AlphaSpace mapping, you must load the "chimera_load.py" script once--it's located within the "Example_FCTM" directory--in order to add the "ribbon scaling" settings used by AlphaSpace visualization. After this script has been loaded, the Chimera session can be closed; your version of Chimera will remember these scaling options in the future.)
chimera chimera_load.py
The FCTM results can be visualized using Chimera by loading the "AS_chimera.py" output file:
chimera AS_chimera.py
There will be seven different visualization states saved and accessible through the "animations" module, which can be found in the Chimera menu bar under Tools > Utilities > Animations. (note: for this section we use screen_by_lig_cntct = False and screen_by_face = True in order to expand the pocket selection to all pockets containing at least 50% "interface" atoms):
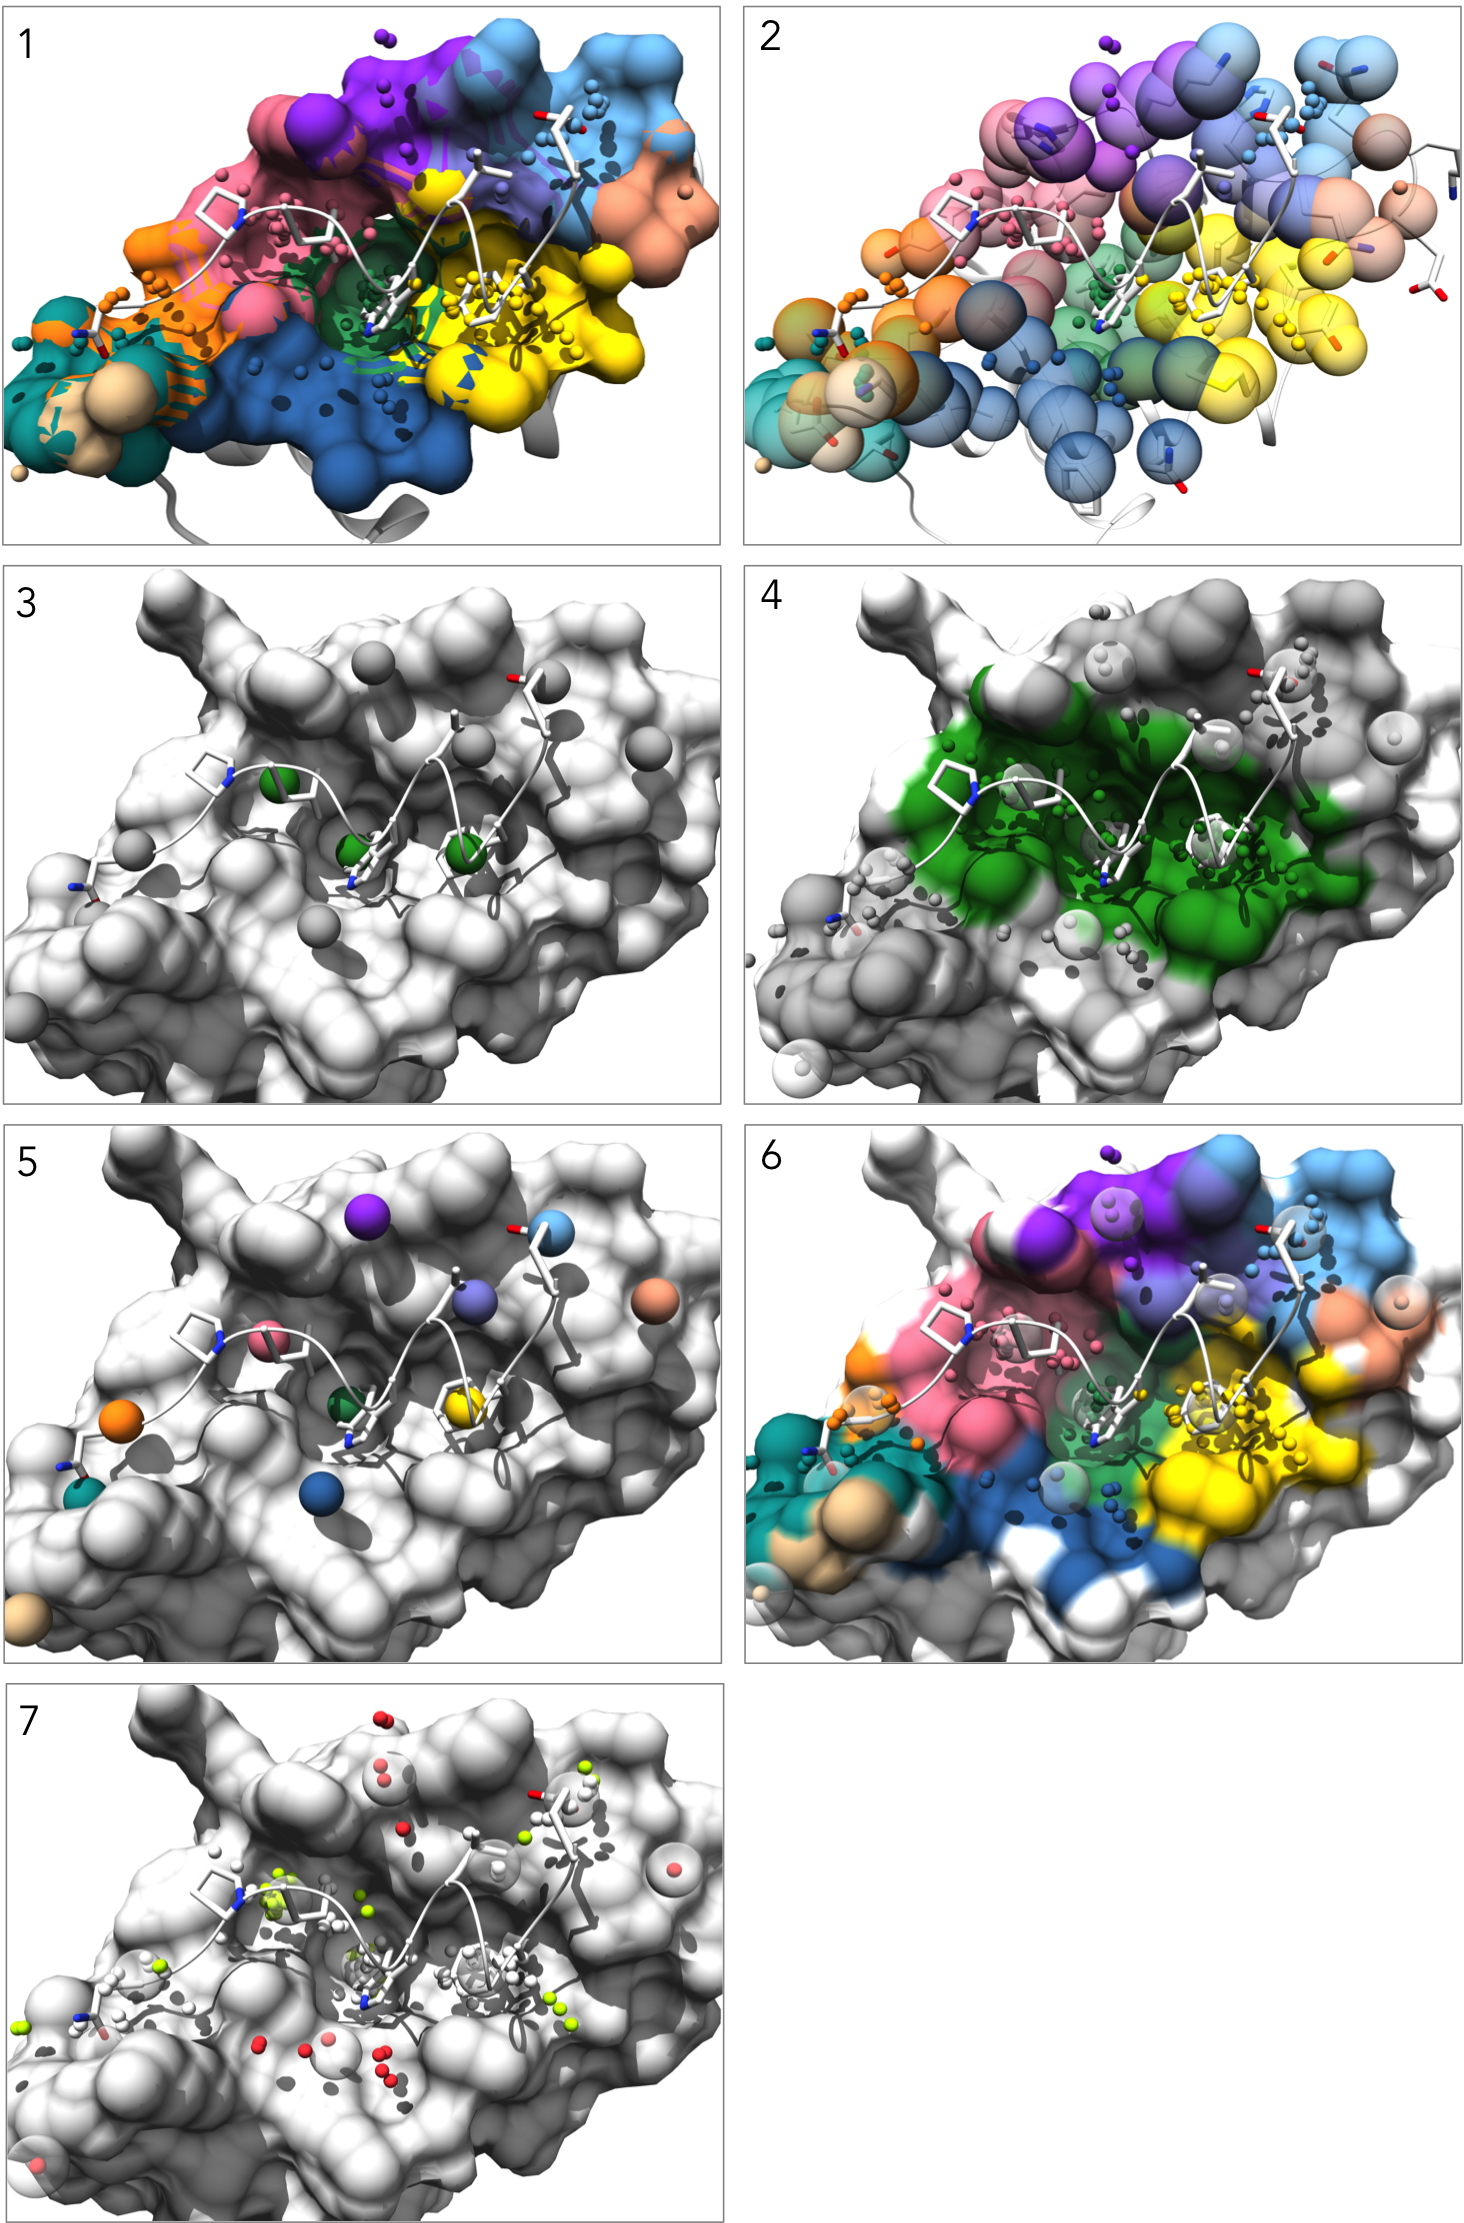
Visualizations
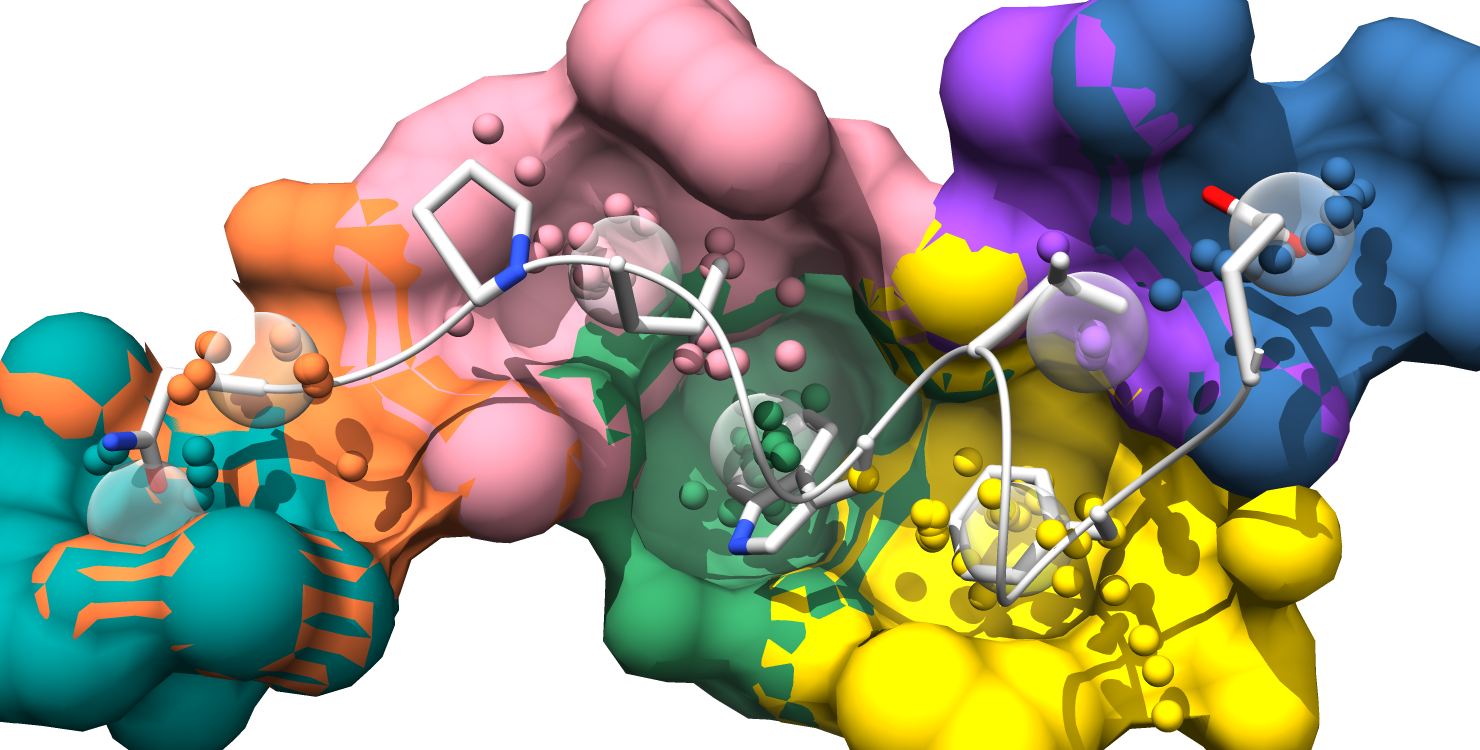
1. Each pockets is represented as an individual surface and colored to match the pocket-score table.
2. Pockets are represented as transparent atomic spheres and the residues participating in pockets are represented as stick
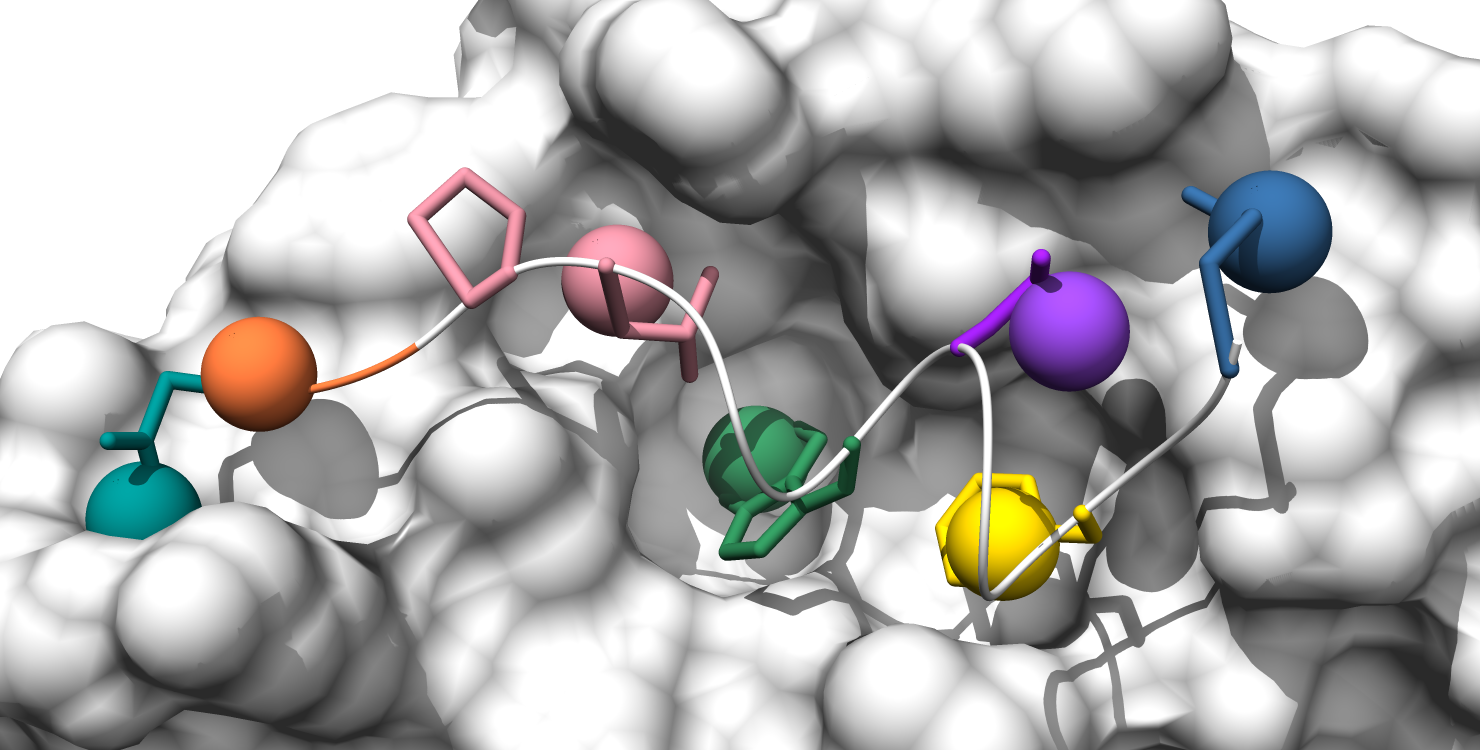
3. Pockets are represented by the alpha-cluster centroids, colored to indicate pocket classificaltion based on pocket score level: core pockets (green), auxiliary pockets (blue), or minor pockets (rosy brown). (note: In this example there happen to be no auxiliary pockets.)
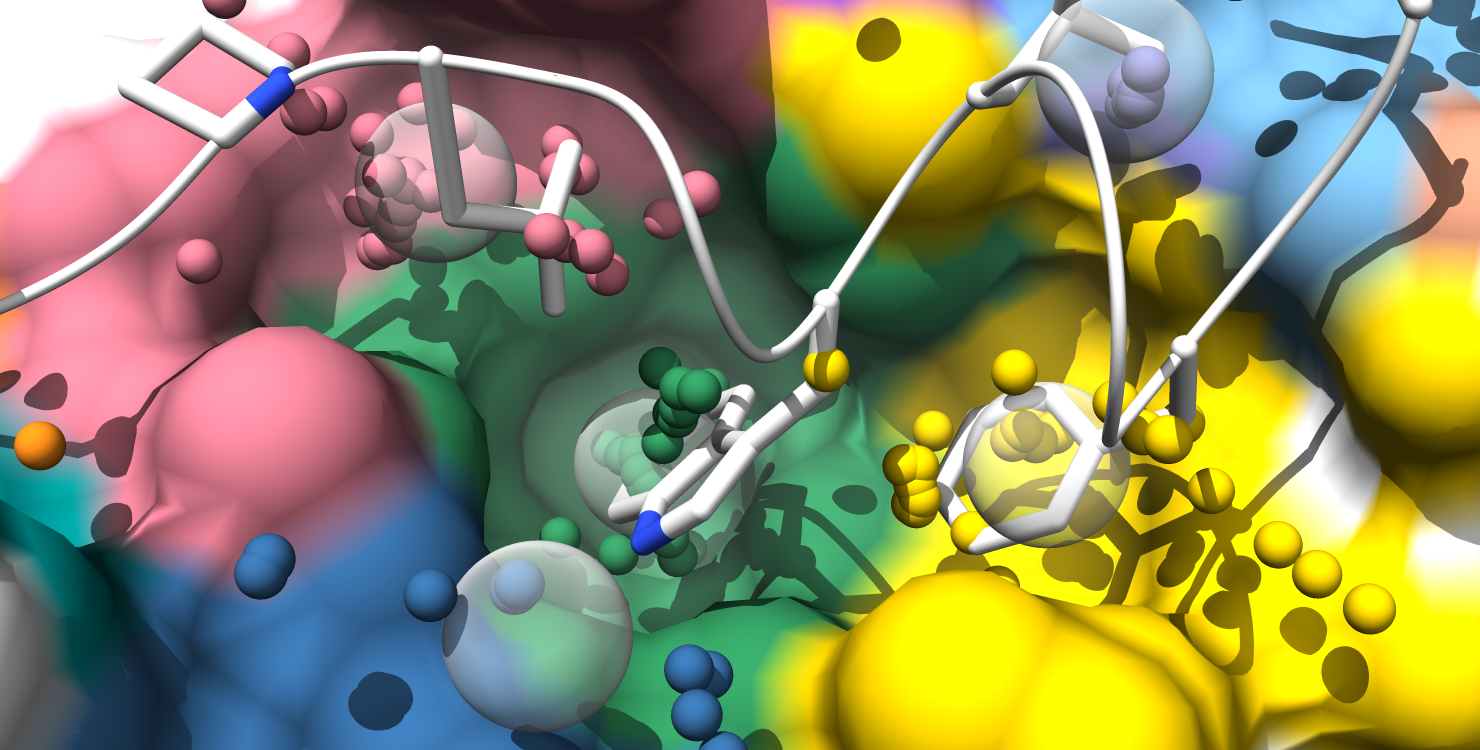
4. Pockets are still colored by classification, but now all alpha-atom centers are shown, the pocket surface is colored, and alpha-cluster centroids are transparent spheres.
5. Pockets are represented by the alpha-cluster centroids, colored-coded to match the pocket-score table.
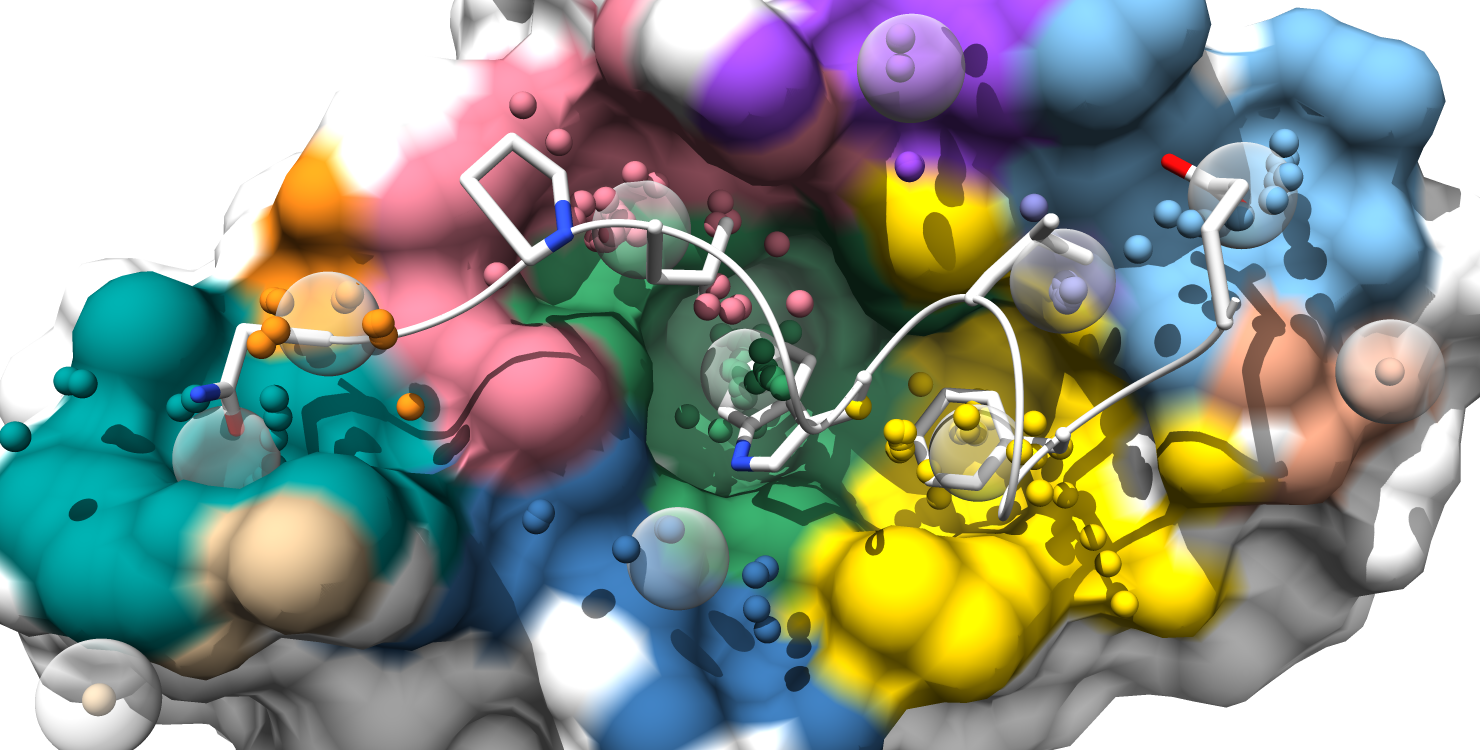
6. Pockets are still color-coded to match the pocket-score table, but all alpha-atom centers are shown and the surface is colored by pocket. (note: surface atoms that participate in multiple pockets are colored based on the atom's highest scoring pocket)
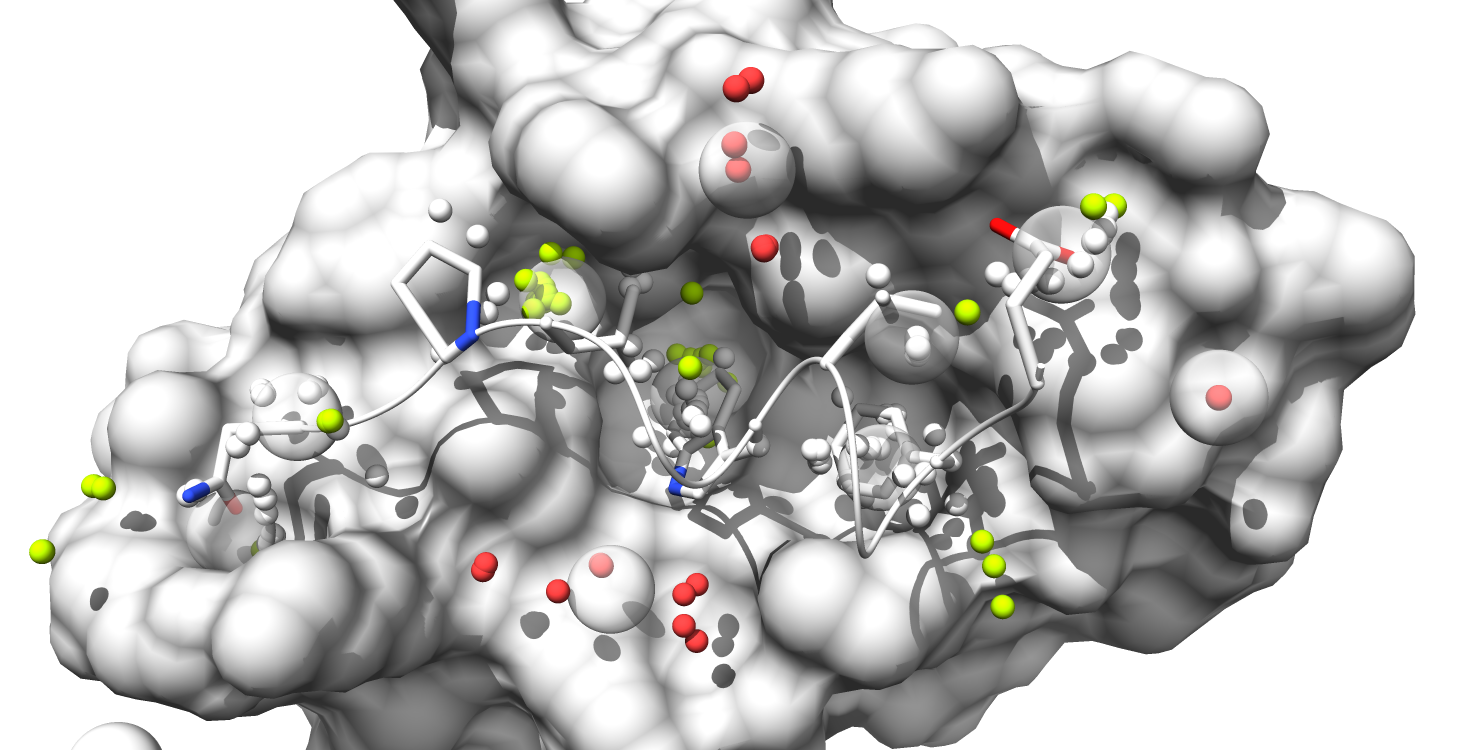
7. Alpha-atom centers are colored based on occupation state. All alpha-atoms in "contact" with the ligand are colored white. Unoccupied alpha-atoms are colored chartreuse if they belong to a partially occupied pocket and colored coral if they belong to a fully unoccupied pocket.
Pocket matching is performed by running the program Match.py, also in the "Program" directory. As with FCTM, Match.py will look for the "AS_param.txt" and "AS_option.txt" settings files first in the current working directory, and otherwise will use the default option and parameter files from the "Program" directory. The multiple PDB input files to be matched are passed to the program from the command line as arguments:
python "your_program_directory"/Match.py "your_protein_1".pdb "your_protein_2".pdb ...
Pocket matching requires that all structures to be matched have the same number of atoms. Residue numbering should be consistent between structures, and the program will automatically ensure they have the same number of atoms by removing from all structures any atoms not found in all structures. The list of any removed atoms will be in the output file "strippedAtoms.dat".
The program generates a "Pocket_matching" directory and, within this, a separate directory to hold the AlphaSpace FCTM results for each structure being matched. Two chimera visualization files are generated for each structure. "AS_chimera.py", loaded as described in the FCTM tutorial above, will color pockets by score. Alternatively, "AS_chimera_match.py" can be loaded to color pockets according to the Pocket matching result (i.e. all matching pocket will be color coordinated between the various structures):
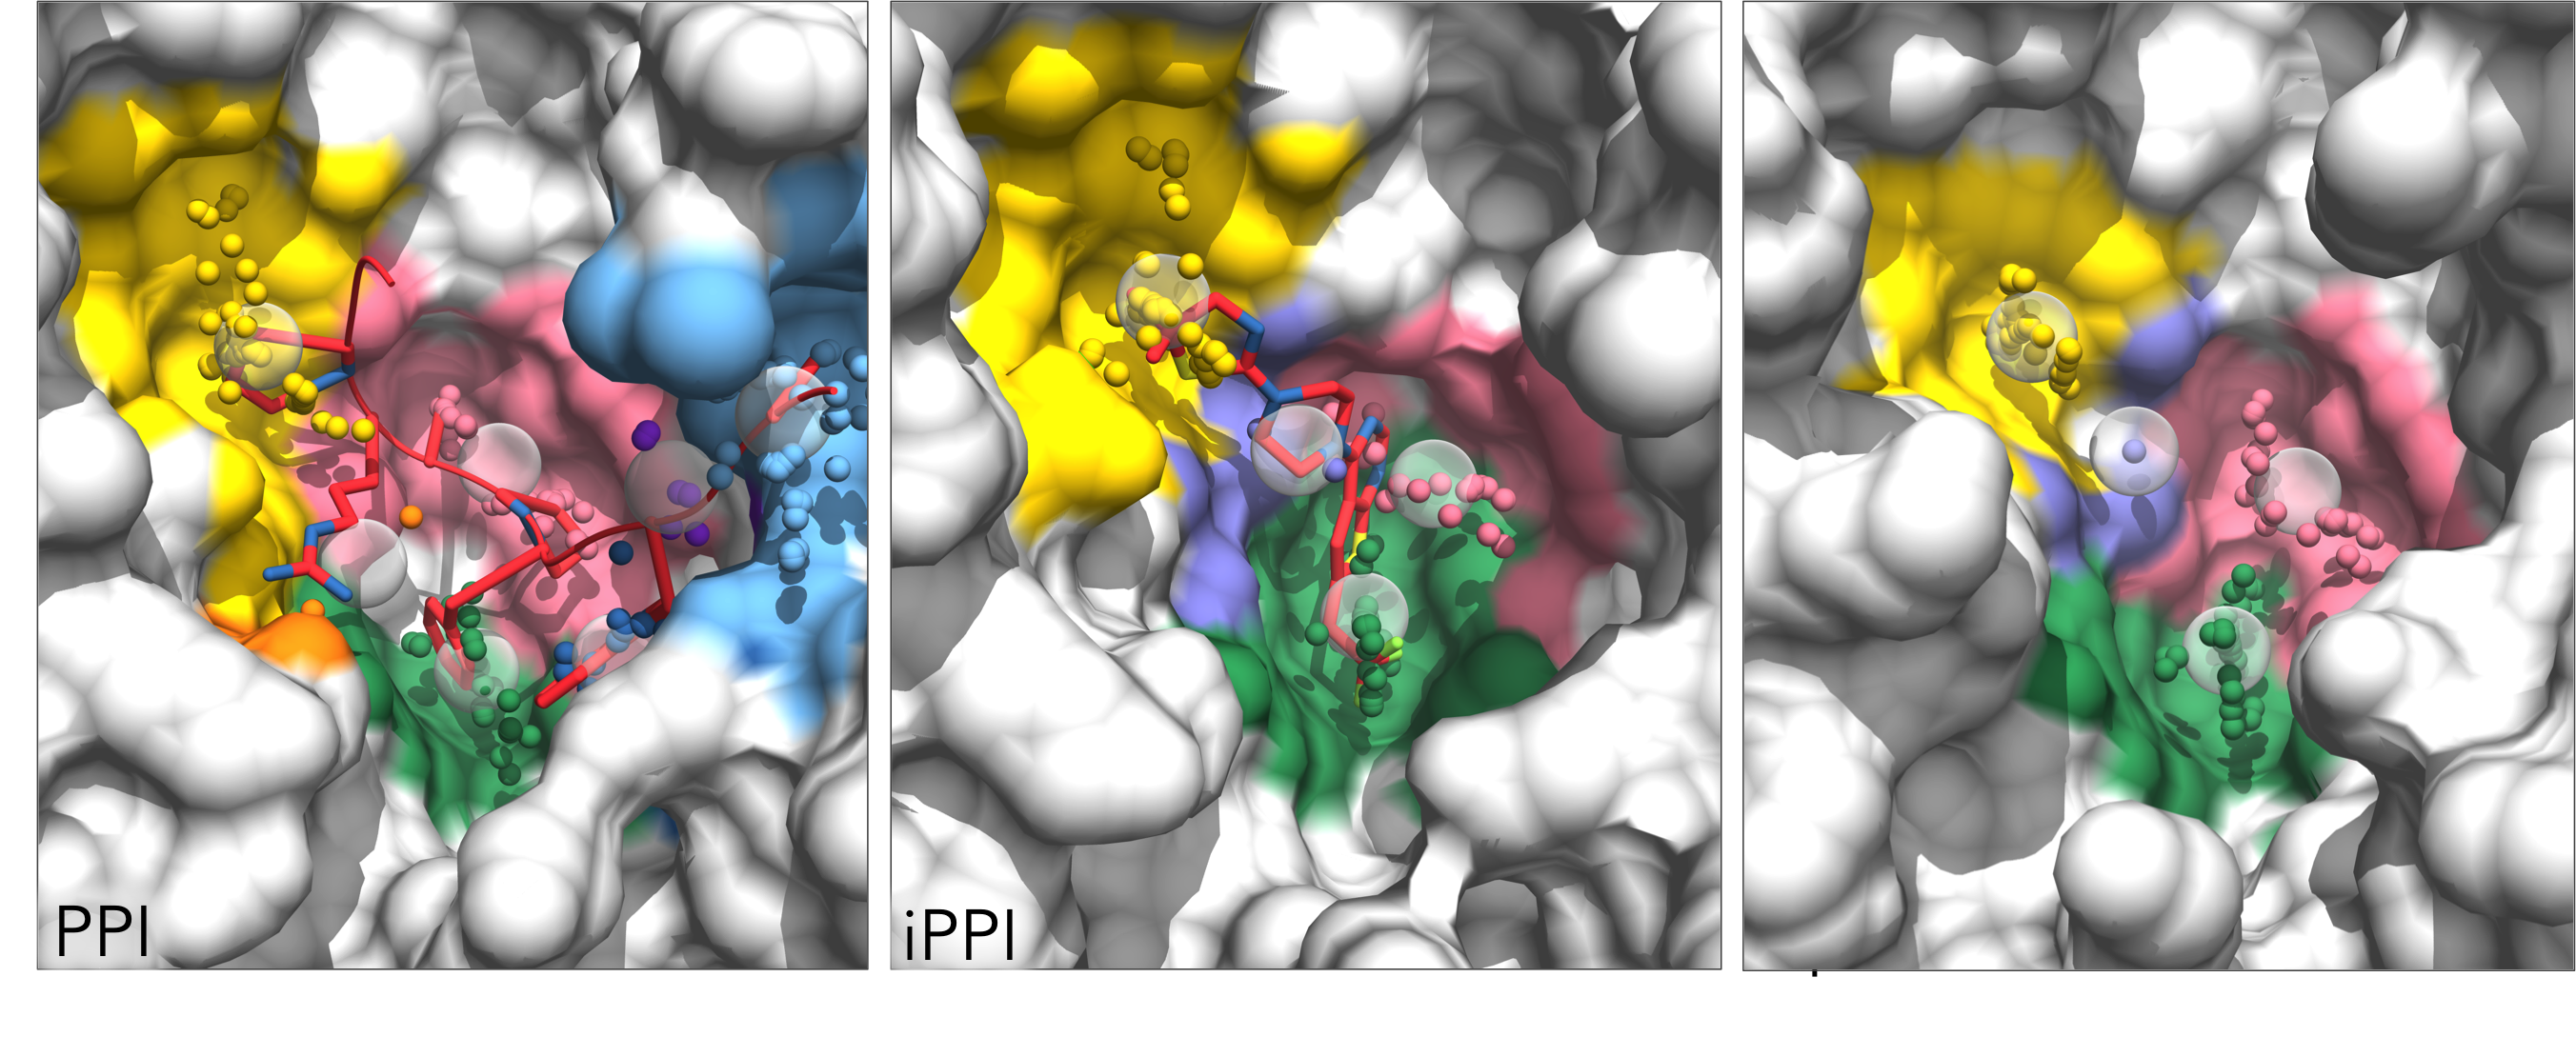
The Pocket matching result is listed in "Result_match.txt", including the overall pocket group similarity and the score and percent occupation for all matched pockets within that group:
#Rank Color GroupSim Score Occ Score Occ Score Occ
1 green 0.80 129 79% 121 89% 123 83%
2 yellow 0.80 139 96% 96 56% 143 38%
3 pink 0.73 -- -- 7 35% 3 100%
4 teal 0.61 125 62% 117 73% 82 81%
5 orange 0.00 2 77% -- -- -- --
6 blue 0.00 30 98% -- -- -- --
7 purple 0.00 22 22% -- -- -- --
8 ltblue 0.00 201 89% -- -- -- --